These NJ towns have at least 71% of the population boosted against COVID
New Jersey appears to have thrown a new wrinkle into its COVID-19 data dashboard this week.
Those who go to covid19.nj.gov for updated information about the coronavirus and the ongoing pandemic may have been surprised to see a new subcategory under the first tab, "Vaccination Overview."
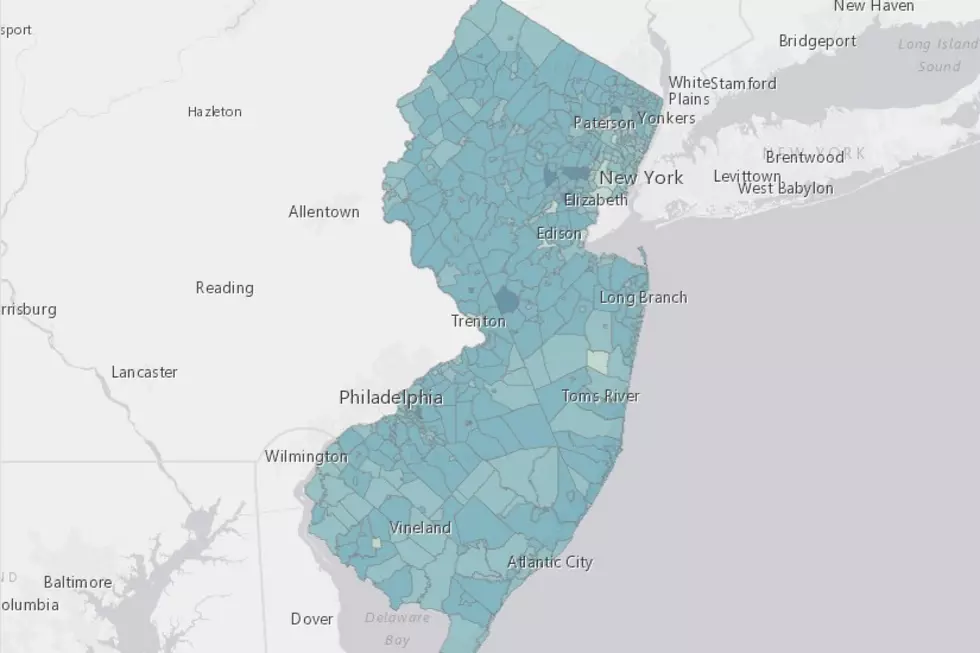
That tab still begins with two side-by-side, town-by-town maps of the Garden State, showing first the percentage of the population with one dose of a COVID-19 vaccine, and then those who have completed their primary series, either through a second shot of Pfizer or Moderna or one shot of the Johnson & Johnson vaccine.

Until this week, a right-arrow click brought users directly to a breakdown of how many people are vaccinated in New Jersey, by age, gender, and race or ethnicity.
But now sandwiched in between is a new map, that of "persons with at least one booster/additional dose." As with the original maps, this one is shaded lightest to darkest the higher the percentage of the population goes, and accounts for the fact that vaccines have not yet been approved in the U.S. for children under age 5.
The state clarifies that "booster" doses are those given to individuals with healthy immune systems, while "additional" doses have been offered to people with compromised immunity.
From tiny Tavistock to towns with tens of thousands of residents like Westfield and West Windsor, 11 New Jersey municipalities currently boast a population that's more than 70% boosted — or the same percentage Gov. Phil Murphy had originally set as a baseline for the state's adult population to get fully vaccinated a year ago.
Tavistock, Camden County — 100%
Haddonfield, Camden County — 72%
Millburn, Essex County — 72%
South Orange, Essex County — 72%
West Windsor, Mercer County — 72%
Chatham Twp., Morris County — 71%
Glen Ridge, Essex County — 71%
Glen Rock, Bergen County — 71%
Maplewood, Essex County — 71%
Pennington, Mercer County — 71%
Westfield, Union County — 71%
Patrick Lavery is a reporter and anchor for New Jersey 101.5. You can reach him at patrick.lavery@townsquaremedia.com
Click here to contact an editor about feedback or a correction for this story.
NJ beach tags guide for summer 2022
See the Must-Drive Roads in Every State
Every NJ city and town's municipal tax bill, ranked
More From 92.7 WOBM


