Despite NJ population gain, people are fleeing from these 200 towns
TRENTON – While New Jersey’s cities grew in the 2010s, in some instances for the first time in decades, the opposite is happening in the state’s more rural areas.
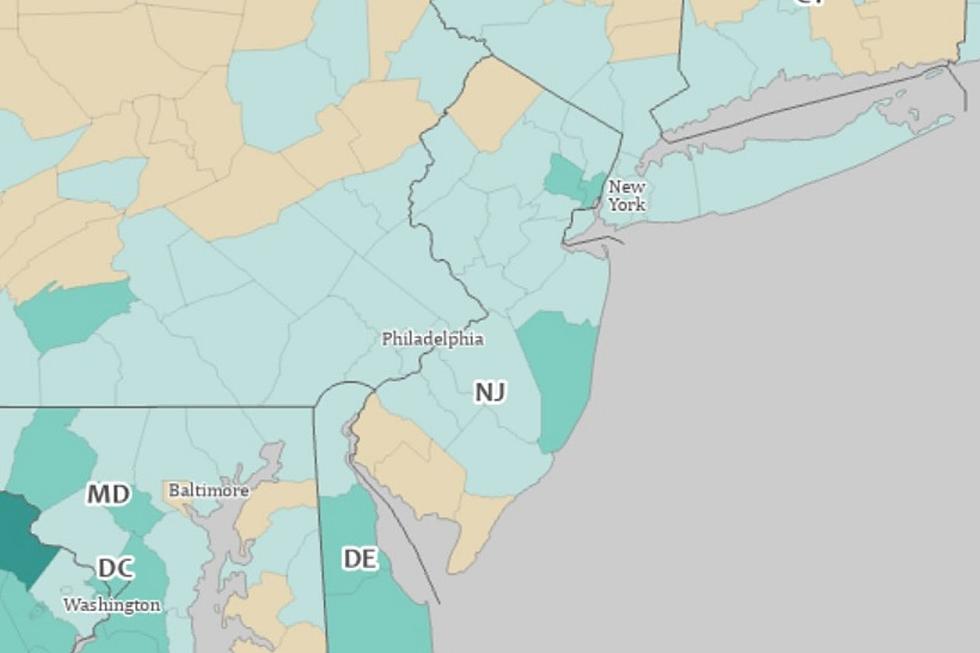
Two hundred of the 565 municipalities lost population in the last 10 years. The state as a whole added nearly 500,000 to its count, seemingly puncturing the oft-repeated concerns about people fleeing the state, but that contraction was the experience in some parts of the state.
The state’s seven least densely populated counties were the ones that shrank or grew the slowest. Tim Evans, director of research at New Jersey Future, said it mirrors the national trend toward urbanization, even in what’s already the nation’s most urban state.
“A larger and larger percent of the country’s population lives in metropolitan areas,” Evans said. “In New Jersey, that’s kind of a moot point because every county in New Jersey is part of one metropolitan area or another. But if you take the concept of what the metropolitan areas are meant to represent, it’s urbanization.
“Cumberland and Salem, even though they’re technically part of metropolitan areas, they’re among the least urbanized counties in the state. And the same thing with Sussex. Sussex is a very outlying county for the New York metro area,” he said. “So, this may be a case of what’s visible as a national trend by looking at the county level, it’s also making itself seen in New Jersey if you look at the subcounty level.”
For instance, Bridgeton grew substantially and Vineland grew marginally – while 11 of the other 12 towns in Cumberland County shrank. Five of Salem County’s townships shrank more than 5%, while Salem City added residents for the first time since the 1940s.
“At the county level, Cumberland and Salem are pretty rural,” Evans said. “But, if you look within Cumberland, it’s the urban areas that are still gaining and the rest of the county that’s losing.”
NJ towns with biggest population drops (by percentage)
20. Wrightstown
Burlington County
2020 population: 720
10-year change: -82 (-10.2%)
19. West Wildwood
Cape May County
2020 population: 540
10-year change: -63 (-10.4%)
18. North Wildwood
Cape May County
2020 population: 3,621
10-year change: -420 (-10.4%)
17. Downe
Cumberland County
2020 population: 1,399
10-year change: -186 (-11.7%)
16. Fairfield
Cumberland County
2020 population: 5,546
10-year change: -749 (-11.9%)
15. Beach Haven
Ocean County
2020 population: 1027
10-year change: -143 (-12.2%)
14. Ventnor City
Atlantic County
2020 population: 9,210
10-year change: -1440 (-13.5%)
13. Woodland
Burlington County
2020 population: 1,544
10-year change: -244 (-13.6%)
12. New Hanover
Burlington County
2020 population: 6,367
10-year change: -1018 (-13.8%)
11. Woodbine
Cape May County
2020 population: 2,128
10-year change: -344 (-13.9%)
10. Shiloh
Cumberland County
2020 population: 444
10-year change: -72 (-14.%)
9. Seaside Heights
Ocean County
2020 population: 2,440
10-year change: -447 (-15.5%)
8. Margate City
Atlantic County
2020 population: 5,317
10-year change: -1037 (-16.3%)"
7. Mannington
Salem County
2020 population: 1475
10-year change: -331 (-18.3%)
6. Brigantine
Atlantic County
2020 population: 7,716
10-year change: -1734 (-18.3%)
5. West Amwell
Hunterdon County
2020 population: 3,005
10-year change: -835 (-21.7%)
4. Maurice River
Cumberland County
2020 population: 6,218
10-year change: -1758 (-22.%)
3. Cape May
Cape May County
2020 population: 2,768
10-year change: -839 (-23.3%)
2. Rockleigh
Bergen County
2020 population: 407
10-year change: -124 (-23.4%)
1. Walpack
Sussex County
2020 population: 7
10-year change: -9 (-56.3%)
The state’s biggest drop was in Sussex County, down 5,000 residents. Nearby Warren and Hunterdon counties barely grew. Rutgers University economist James Hughes says that was largely young people wanting a more dynamic place to live.
“That was essentially sprawl withdrawal by millennials. These were millennials leaving the parental hearth, for the most part,” Hughes said. “Young people graduating from college may have gone home for a while and then decided, ‘Hey, this is boring living in Sussex. I’m moving to Jersey City, Hoboken and the like.’”
Twenty-two of 24 municipalities in Sussex County lost population, with the town of Newton the only place adding more than 26 residents. In Warren County, Phillipsburg and Hackettstown grew as most townships shrank.
Hughes says it was a similar story in South Jersey, where Cape May, Cumberland and Salem counties contracted around 2%, by nearly 6,000 people combined. Atlantic County shrank too, but barely.
“They also lost millennial children there, but they were out of the commuter shed, so it was too difficult to commute to Philadelphia,” Hughes said. “So, growth really took place in closer-in areas because Philadelphia was the big growth locomotive for southern New Jersey.”
Gloucester County added 14,000 residents and Camden County nearly 10,000. The population of Philadelphia was up 5%, nearly 78,000 people, the city’s most since the 1940s.
Biggest total losses in population
20. Jefferson
Morris County
2020 population: 20,538
10-year change: -776 (-3.6%)
19. Hopatcong
Sussex County
2020 population: 14,362
10-year change: -785 (-5.2%)
18. Lower Township
Cape May County
2020 population: 22,057
10-year change: -809 (-3.5%)
17. Freehold Township
Monmouth County
2020 population: 35,369
10-year change: -815 (-2.3%)
16. West Amwell
Hunterdon County
2020 population: 3,005
10-year change: -835 (-21.7%)
15. Cape May
Cape May County
2020 population: 2,768
10-year change: -839 (-23.3%)
14. Millville
Cumberland County
2020 population: 27,491
10-year change: -909 (-3.2%)
13. Asbury Park
Monmouth County
2020 population: 15,188
10-year change: -928 (-5.8%)
12. West Milford
Passaic County
2020 population: 24,862
10-year change: -988 (-3.8%)"
11. Pemberton
Burlington County
2020 population: 26,903
10-year change: -1,009 (-3.6%)
10. New Hanover
Burlington County
2020 population: 6,367
10-year change: -1,018 (-13.8%)
9. Margate City
Atlantic County
2020 population: 5,317
10-year change: -1,037 (-16.3%)
8. Atlantic City
Atlantic County
2020 population: 38,497
10-year change: -1,061 (-2.7%)
7. Little Falls
Passaic County
2020 population: 13,360
10-year change: -1,072 (-7.4%)
6. Ventnor City
Atlantic County
2020 population: 9,210
10-year change: -1,440 (-13.5%)
5. Brick
Ocean County
2020 population: 73,620
10-year change: -1,452 (-1.9%)
4. Vernon
Sussex County
2020 population: 22,358
10-year change: -1,585 (-6.6%)
3. Brigantine
Atlantic County
2020 population: 7,716
10-year change: -1,734 (-18.3%)
2. Maurice River
Cumberland County
2020 population: 6,218
10-year change: -1,758 (-22.%)
1. Camden
Camden County
2020 population: 71,791
10-year change: -5,553 (-7.2%)
Close to 15% of New Jerseyans, more than 1.35 million, in 2020 lived in municipalities where the population dropped in the past decade.
That’s another way in the which the population patterns changed. The last census in 2010 found that 212 municipalities in New Jersey had lost population in the prior decade, a similar total to the recent census.
But in the 2000s decade, those places were home to nearly 2.2 million people, about 25% of the state’s 2010 population. Larger places were more common among those shrinking at that time.
Find your town in the chart
Michael Symons is State House bureau chief for New Jersey 101.5. Contact him at michael.symons@townsquaremedia.com.
Census 2020: The 20 biggest places in New Jersey
NJ towns and their nicknames
More From 92.7 WOBM


